

Access to data that is visualised in an easy to consume way is critical to understanding insights. That’s why Aptem has built-in dashboards. They enable users at all levels across an organisation to effectively learn, track and manage their programmes.
Aptem’s single-page dashboards provide an instant snapshot of key analytics and reports of user programmes. You also have the ability to drill down for more detailed insights, making reporting easy across your training programmes.
The functionality of each training reporting dashboard is broken down below – Performance Dashboard, Tutor Dashboard, Learner Dashboard, Employer Dashboard, Work Coach Dashboard, Participant Dashboard.
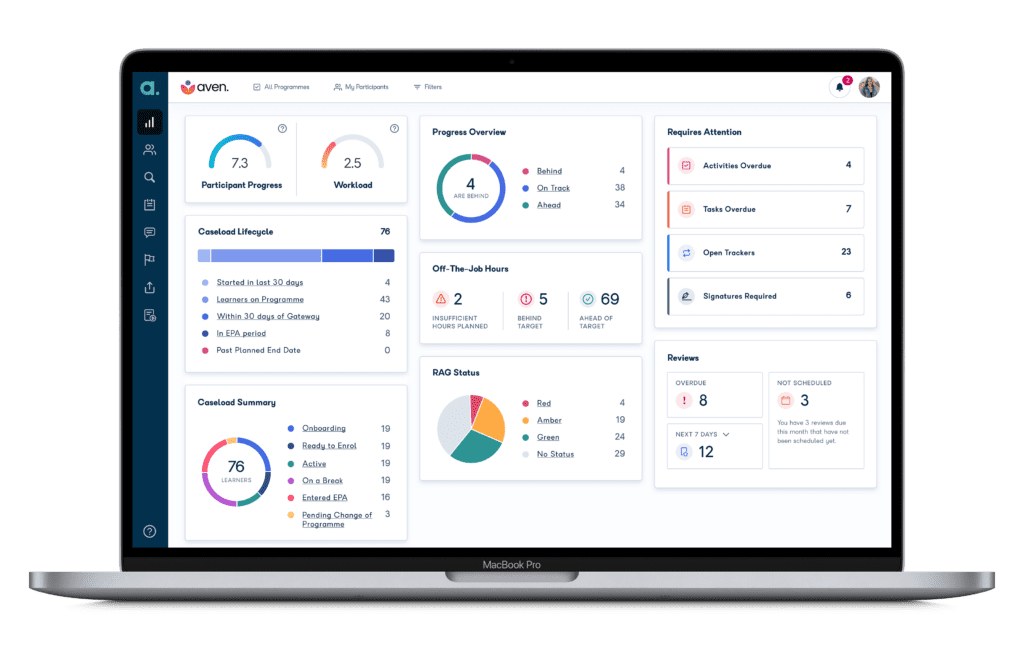
Performance Dashboard
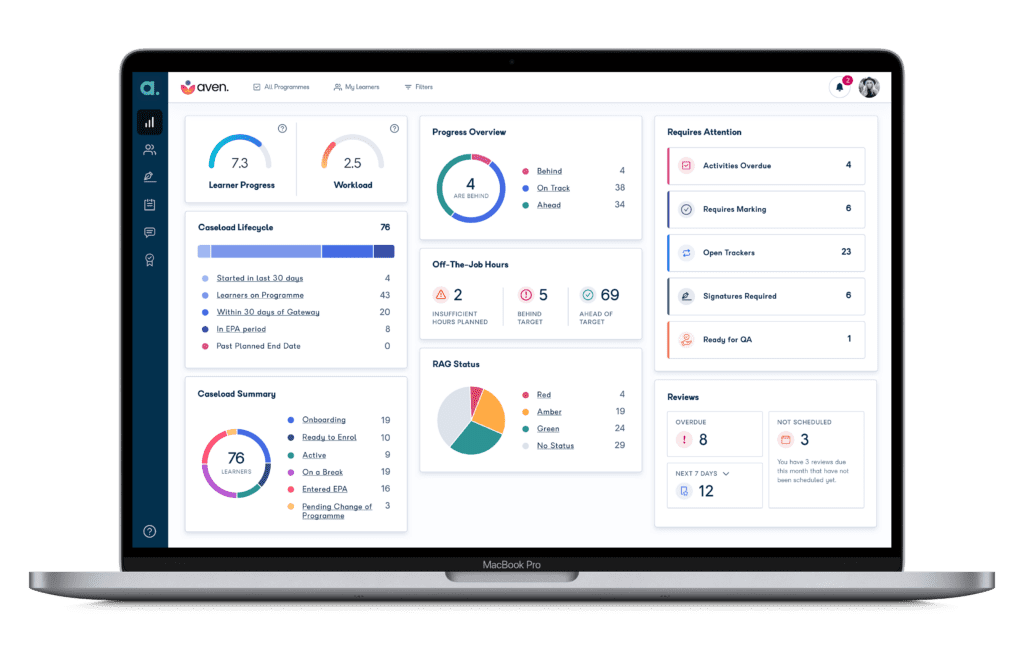
Summary: Designed to provide insights to help identify issues and optimise productivity. This allows organisations to efficiently manage programme workloads and track the performance of tutors, teams, and the entire organisation.
- Learner Progress and Workload – indicates how learners are progressing and whether they are on top of their workload.
- Caseload Lifecycle – shows caseload distribution across the different stages of a learners’ programme, and helps you to quickly identify ‘next’ steps as they approach their End Point Assessment period.
- Caseload Summary – gives a breakdown of your learners’ statuses, for example ‘Onboarding’, ‘Ready to Enrol’, ‘Active’ or ‘Entered EPA’.
- Progress Overview and RAG Status – shows how many learners are behind, on track, ahead, allowing you to focus your support where it is needed most. Clicking into these statuses will provide additional detail and related actionable items.
- Requires Attention – gives a breakdown of items that require focus. You can drill down into each item and view a list of learners attributed to each area of concern.
- Reviews – enables you to keep on top of review meetings; view the number of learners with overdue reviews, scheduled reviews or reviews that require scheduling.
- Off-The-Job Hours – allows you to quickly identify whether learners are on track to meet their required off-the-job-hours.
Measuring performance:
- Operation Managers also have a snapshot of how their team of Tutors or Work Coaches are performing, see how learner cohorts are progressing, and whether they’re on track.
- Senior Leadership Team members can filter the Performance Dashboard by Programme and Employer to see the health of learners on specific programmes, or under a specific employer – helping them to identify where support and improvements are needed.
“The Performance Dashboard will completely change the way that we are looking at our data and the way that our tutors are managing their caseloads.” Natalie Doughty, Quality Manager at Learnmore Network.
Employer Dashboard
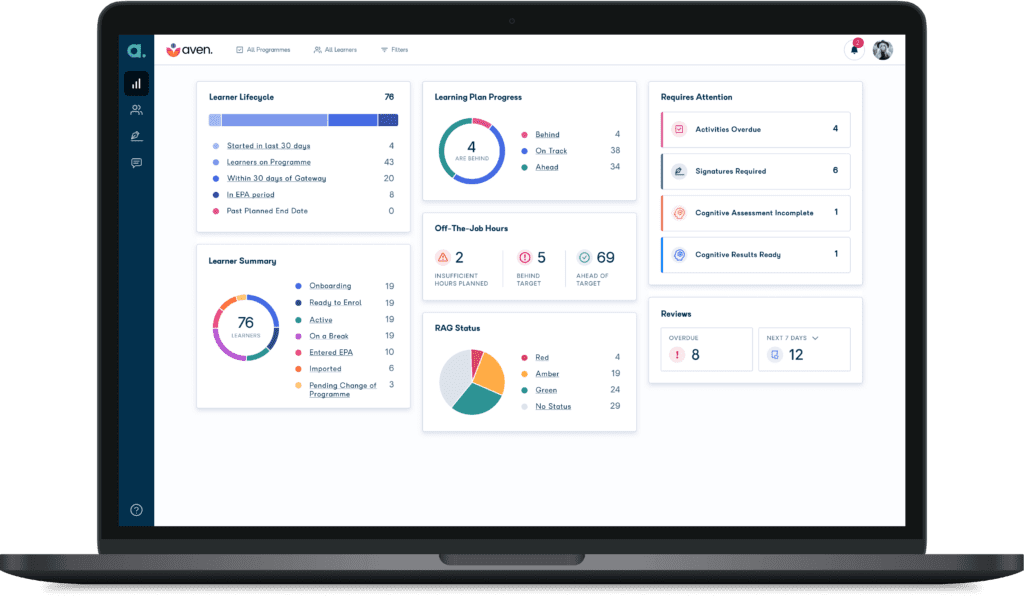
Summary: Built to help employers easily monitor progress of direct reports and teams who are on programme. This dashboard gives you insight into the performance of learners across the organisation and allows you to drill down by brand, region, branch, sector, programme, or team.
- Learner Lifecycle – shows how many learners are in each stage of the programme.
- Learner Summary – gives a breakdown of learners categorised by their programme statuses. Clicking on any of these statuses will display more detailed information and related actionable items.
- Learning Plan Progress – tracks learner progress as measured by their performance on their learning plan activities and summarises the number of learners who are behind/on-track/ahead on their learning plan activities. You are able to determine thresholds of these statuses.
- Off-The-Job Hours – enables you to quickly identify whether learners are on track to meet their required off-the-job-hours.
- RAG Status – allows you to focus your support when it’s needed. Each of these statuses is interactable, meaning you can click to see details of each status, and their related actionable items.
- Requires Attention – a useful summary of potential areas for concern. Click through to see a list of affected learners so you can take prompt action.
- Reviews – enables you to keep on top of review meetings; view the number of learners with overdue reviews, scheduled reviews or reviews that require scheduling.
Filtering on dashboards:
- Quick Filters allow you to limit the view by programmes, learners, or any other available filters.
- Detailed filters allow for filtering by programme, learners, groups, tutor, employer group, and employer. Each of these filtering options offers you a multi-select list (except for learners).
To learn more about the filtering functionality, visit our Aptem Help Centre article here.
Tutor Dashboard
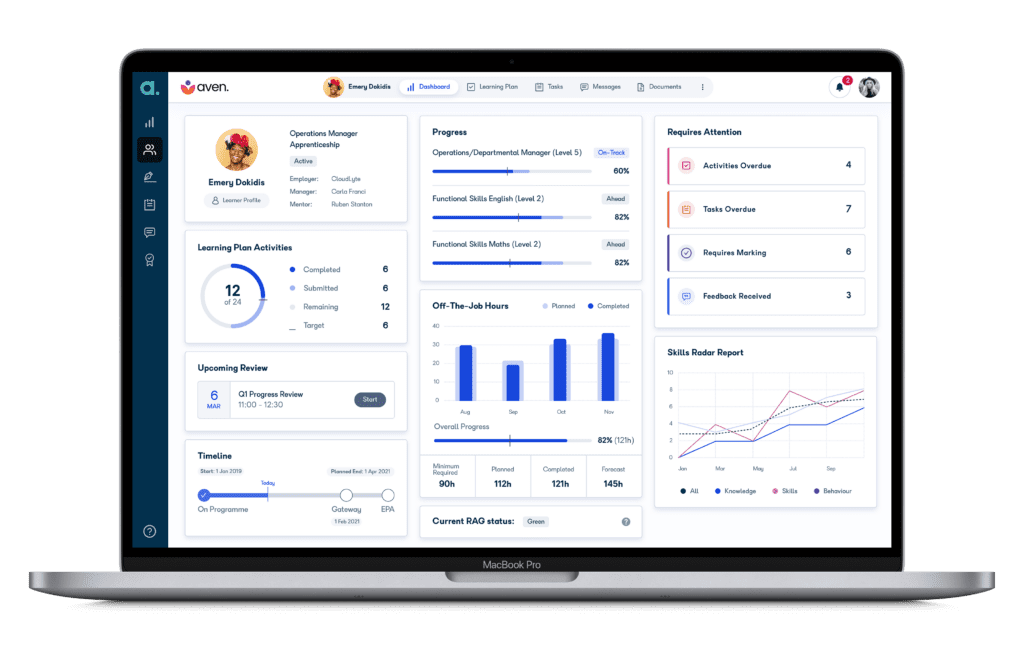
Summary: Gives an effective, single-page overview of a learner’s progress providing the tutor with the tools and data to keep on top of their learners.
- Title – provides contact details of the learner, their employer, manager, and mentor. Tutors can access the learner’s profile for additional detail.
- Learning Plan Activities – gives a breakdown of the activity status which helps to ascertain whether a learner needs prompting.
- Upcoming Review – saves the tutor time by taking them straight to the upcoming reviews.
- Timeline – illustrates the learner’s current stage in the programme, along with milestone dates.
- Progress – allows the tutor to identify whether a learner is on track. Progress flags show areas for concern.
- Off-The-Job Hours – gives a breakdown of off-the-job hours with a forecast displaying the sum of completed off-the-job hours and all future planned off-the-job hours.
- RAG status – allows tutors to focus support when it’s needed. Each of these statuses is interactable, meaning you can click to see details of each status, and their related actionable items.
- Requires Attention – provides a useful summary of potential areas for concern. Tutors can click through to see a list of affected learners so you can take prompt action.
- Skills Radar Report – gives a summary of the learner’s Skills Radar scores to help tutors understand their skills and competencies, and their progression using a scoring system numbered 0-10.
Learner Dashboard
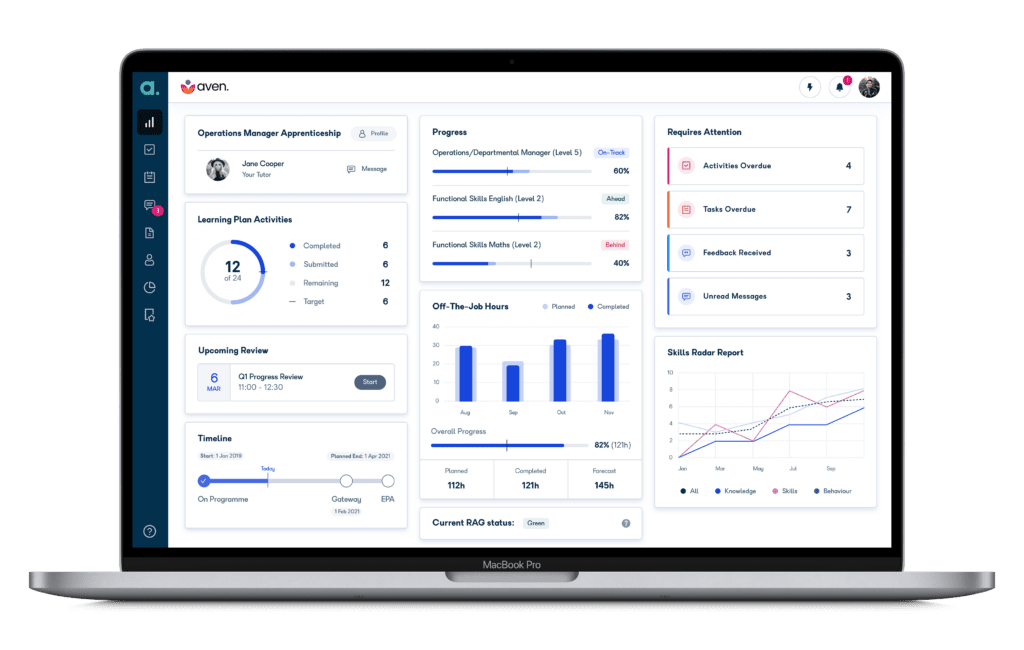
Summary: Gives a single, reliable overview of the entire programme that helps the learner take ownership for keeping their learning on track.
- Title – learners can the view contact details of their employer, tutor, and mentor. They can access each profile to send messages and get in contact.
- Learning Plan Activities – provides a breakdown of activity status, indicating progress. This helps learners to keep on track throughout their programme.
- Upcoming Review – highlights upcoming reviews, saving the learner time.
- Timeline – shows learners which stage they are at in the programme, along with milestone dates.
- Progress – if a learner is enrolled on multiple programmes, they can track the progress of each programme with flags indicating areas for concern.
- Off-the-job Hours –shows the planned and completed OTJ hours for each month. Enables learners to stay on top of their OTJ hours progress.
- RAG Status – enables learners to quickly see if they are on track with their programme.
- Requires Attention – gives a breakdown of various items requiring the learner’s attention.
- Skills Radar Report – learners can access a summary of their Skills Radar scores to better understand their strengths and weaknesses, using KSBs for their reference. They can also measure their progress over time.
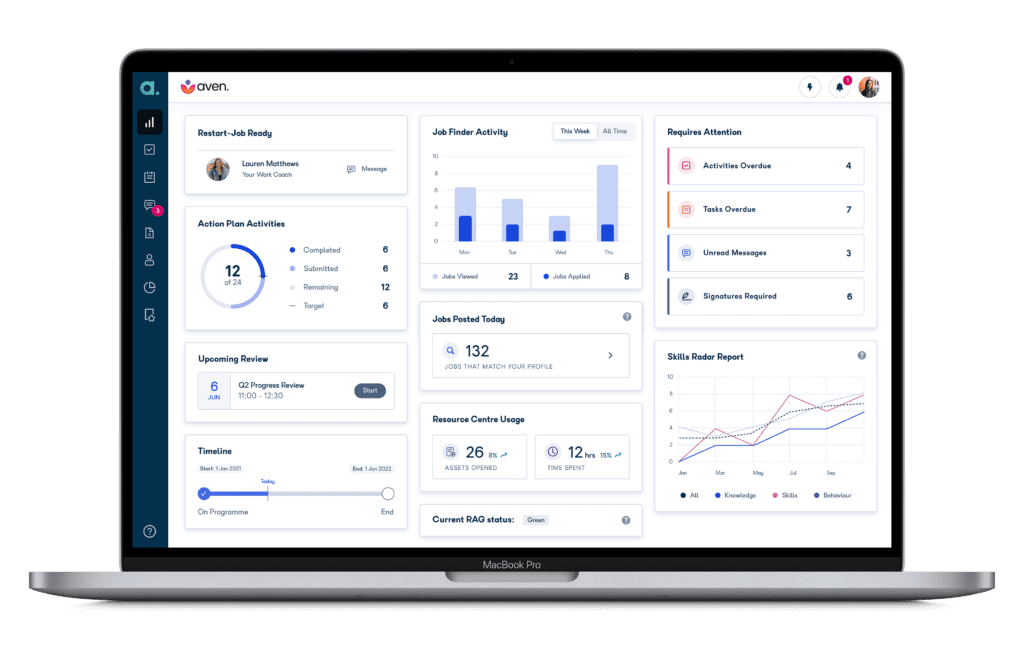
Work Coach Dashboard
Summary: Provides work coaches with instant access to key analytics to support clients with their re-employment programmes.
- Title – shows the participant’s/jobseeker’s name and contact details, their main programmes and access to their profile.
- Action Plan Activities – gives a breakdown of the activity status which helps to identify participants that need prompts or support. Examples of activities include creating a CV and undertaking a mock interview.
- Upcoming Review – highlights upcoming reviews, saving the work coach time.
- Timeline – illustrates the participant’s current stage in the programme along with milestone dates.
- Job Finder Activity – gives a summary of the number of jobs viewed and jobs applied by the participant. Work coaches can see this in two views – current week and all-time.
- Jobs posted today – shows the number of new jobs posted that matches the participant’s profile.
- Resource Centre Usage – usage figures indicate the interaction with available resources/assets, with percentages indicating an increase or decrease in assets viewed over a 7-day period.
- RAG Status – informs the work coach about how participants are doing with respect to their RAG status, allowing them to focus your support when it’s needed. The coach can click onto each status to get more detailed information and related actionable items.
- Requires Attention – gives a breakdown of items that require focus. The coach can drill down into each item. Activities and tasks can be prescribed by the employability provider. Open trackers include open cases where something could require fixing.
- Skills Radar Report – shows a summary of the participant’s Skills Radar scores to hep the coach understand their skills and competencies, measured against KSBs and soft skills for employability. This can be based upon Aptem criteria or integration from Workstar.
Participant/Jobseeker Dashboard
Summary: Enables participants/jobseekers to keep track of their programme progress using tools such as the Job Finder Activity, Action Plan Activities, and the Skills Radar Report.
- Title – view the work coach’s name and contact details. Participants can also contact them through the message box.
- Action Plan activities – gives a breakdown of the activity status highlighting their progress. As with the Work Coach Dashboard, the visual above illustrates that 12 out of 24 Action Plan Activities have been completed.
- Upcoming Review – highlights upcoming reviews to help the jobseeker keep on top of meetings.
- Timeline – illustrates the participant’s current stage in their programme along with milestone dates.
- Job Finder Activity – shows a summary of the number of jobs viewed and jobs applied. Participants can see this in two views – current week and all-time.
- Jobs posted today – shows the number of new jobs posted that matches the participant’s profile.
- Resource Centre Usage – usage figures indicate the interaction with available resources/assets, with percentages indicating an increase or decrease in assets viewed over a 7-day period.
- RAG status – helps participants to quickly identify whether they are on track with their programme.
- Requires Attention – provides a breakdown of items that require focus. Participants can drill down into each item.
- Skills Radar Report – participants can access a summary of their Skills Radar scores to understand their skills and competencies, measured against KSBs and soft skills for employability. They can also measure their progress over time.
Please note that certain features and functionality highlighted here are exclusive to specific Aptem packages. Please speak to your Business Development Manager, or Customer Success Manager if you are already an Aptem customer, for further information.
